Iron-carbon phase diagram
All quality steel parts follow a design and fabrication process guided by a foundational blueprint that dictates their structure and properties — the Iron-Carbon Phase Diagram. This diagram is an important representation of carbon concentration and temperature for iron-carbon alloys in different phases. It is a powerful tool for manufacturers and metallurgists looking for the best alloys to use for parts.
An alloy’s typical changes in phase, microstructure and temperature can guide about the most appropriate manufacturing material depending on the envisaged use. End users can also base the insights in the phase diagram to choose parts that suit working conditions.
At ProleanTech, we are highly regarded in China and across the borders for unmatched CNC machined parts with all considerations, including the iron-carbon phase diagram. Read on for insights into the phase diagram phenomenon, which can affect the quality of machined parts.
What Is The Iron-Carbon Phase Diagram?
To answer the question of what the iron carbon phase diagram is, let’s first establish what a phase diagram is, which is also sometimes called the iron-cementite diagram. This alternative name is inspired by the virtue of the carbon here being mostly iron carbide (Fe₃C) or cementite.
A phase diagram is a popular concept in the fundamentals of material science. It is a graphical demonstration of the phases of a material that are stable at particular pressure and temperature levels.
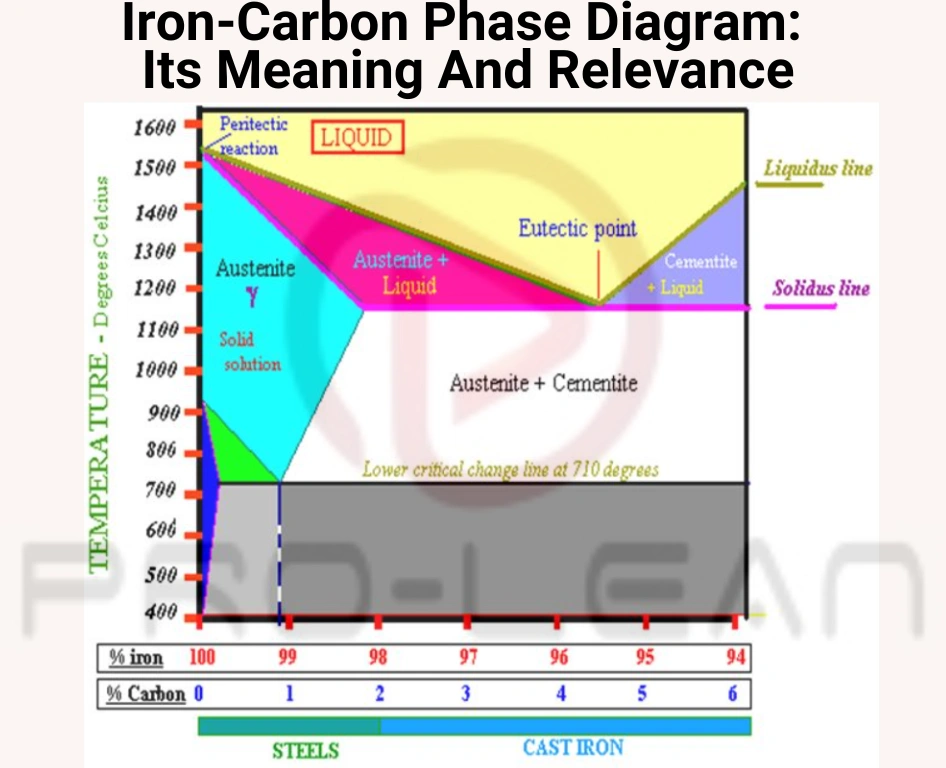
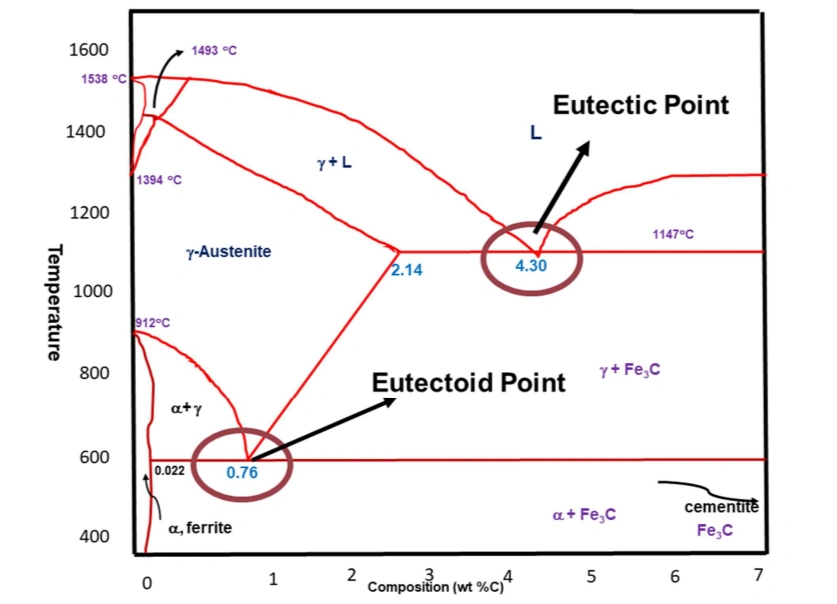
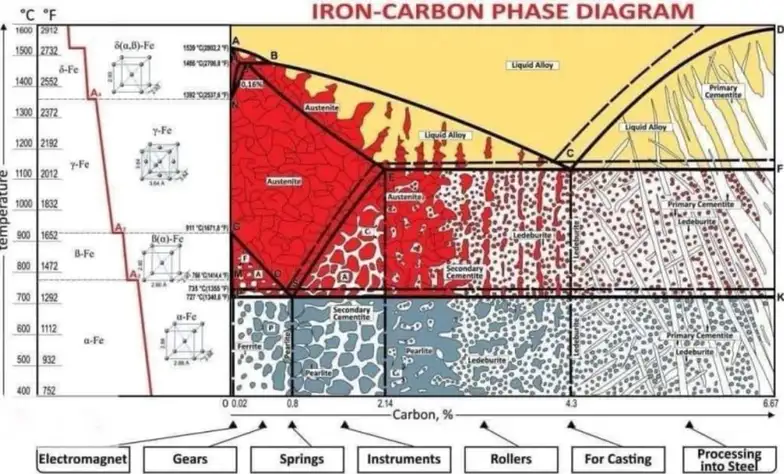
In the iron carbon phase diagram case, the graph shows the phases of iron-carbon alloys at atmospheric pressure and varying temperatures. It shows the phase changes of these alloys based on changes in carbon content and temperature.
The weight of carbon concentrations is on the horizontal axis (X-axis) while the temperature is on the vertical axis (Y-axis).
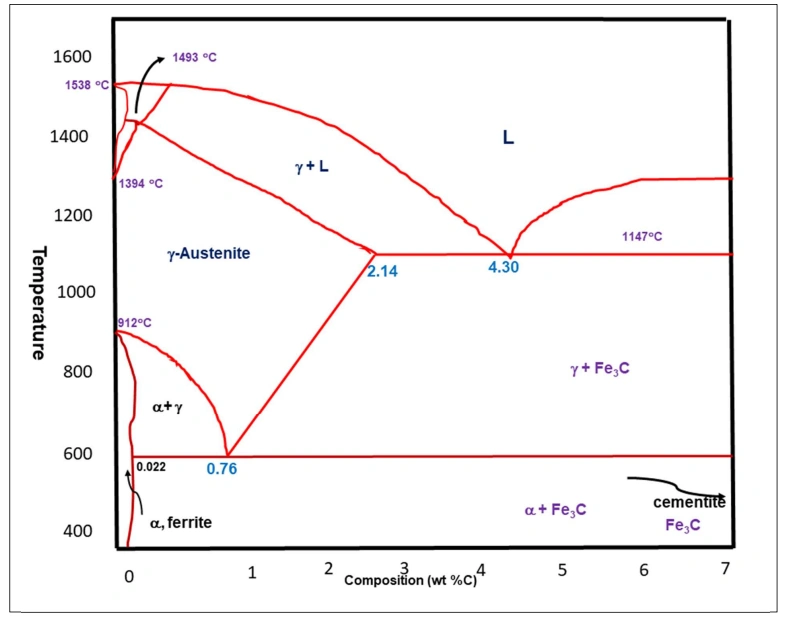
Fe-C diagram’s basics
This graph is essential for metallurgists and engineers who want to understand how cast irons and steel behave under different thermal statuses.
We look at the importance of this graph in more detail in the next section.
Why Is The Fe-C Diagram Important?
With the iron carbon phase diagram, predicting the mechanical properties and microstructures of iron-carbon alloys has never been easier. With an idea of how a particular metal should perform,we can easily determine the alloy combination and heat treatment methods to use and explore CNC machining & its advantages for each material.
As a basic, the iron carbon phase diagram is considered as an indicator of the status of iron-based alloys depending on environmental conditions. We can summarize the importance of the diagram this way:
1. It Is A Predictive Tool
This phase diagram can be used by the manufacturer and engineer as a tool to predict boiling points, melting points, and other phase changes, which are instrumental in part manufacturing and industrial processes involving the material.
2. Helps In The Material Design Process
When considering the material science aspects related to CNC machining of iron-based alloys, the iron carbon phase diagram is a vital designing aid. The designer can consider the envisaged properties of a material and use them to design more relevant CNC machined products.
3. Helps In Enhancing Process Efficiency And Safety
Comprehending the iron and carbon equilibrium diagram is critical for safeguarding the integrity of industrial systems and processes. This applies for areas where phase changes can trigger life threatening and disastrous outcomes.
In brief, the Fe-C diagram is a simplified representation of the complex interaction of iron and carbon, which is valuable for material scientists, designers, engineers, and manufacturers.
Phases In The Iron Carbon Phase Diagram
Carbon has a big effect on the behavior of iron, specifically its mechanical properties. That’s because carbon alters its crystal structure. Properties that change with carbon increase in the phase diagram are brittleness, hardness, and strength.
Carbon also affects steel’s microstructure. It alters some of the metal’s properties including ductility, hardness, and strength.
Features of the Fe-C diagram
The increase in carbon content comes with the formation of different microstructures and phases like austenite, cementite, ferrite, and pearlite.
The table below summarizes the effects of carbon on iron.
| Phase name | Crystal structure | Phase type | Characteristics |
| Ferrite (α) | BCC | low-carbon iron | Very soft and ductile |
| Austenite (γ) | FCC | Solid | Soft and ductile. |
| Cementite (Fe₃C) | Intermetallic compound | Iron carbide (Fe3C) | Very brittle and hard |
| Ledeburite | Eutectic mixture | Blend of austenite and cementite | Extremely hard, present in cast iron |
| Pearlite | Lamellar | Alternating layers of ferrite and cementite | Strong and tough |
| Martensite | BCT | Quenched austenite | Extremely brittle and hard due to fast cooling |
Try Prolean Now!
What Is The Hardest Phase In The Iron-Carbon Diagram?
The hardest phase in the iron-carbon phase diagram is cementite (Fe₃C). Its other name is iron carbide. Cementite derives its name from the Latin terms ‘Caementum’, which means stone chips.
At 6.67% C, this phase is very brittle and hard. These properties are instrumental in the strengthening of cast irons and steels.
The many characteristics and microstructures of steels are attributed to iron carbide. Its coexistent phases are γ phase (γ + Fe3C) and α phase (α + Fe3C) at 727°C-1147°C and below 727°C respectively.
Types Of Alloys In The Iron Carbon Phase Diagram
As hinted by now, there are various cast irons and steels in the iron carbon phase diagrams, all grouped according to their carbon percentage. The phase diagram captures how each of these alloys presents in terms of transformation properties and phase characteristics.
The ferrous alloys in the diagram can be grouped as boundaries, the eutectic point, and phase fields.
1. Boundaries In the Iron Carbon Phase Diagram
There are important lines or boundaries within the diagram designated as A1, A2, A3, A4, and ACM. These are temperatures of phase transformations as the alloys cool or heat. They are representatives of points at which an alloy changes phases.
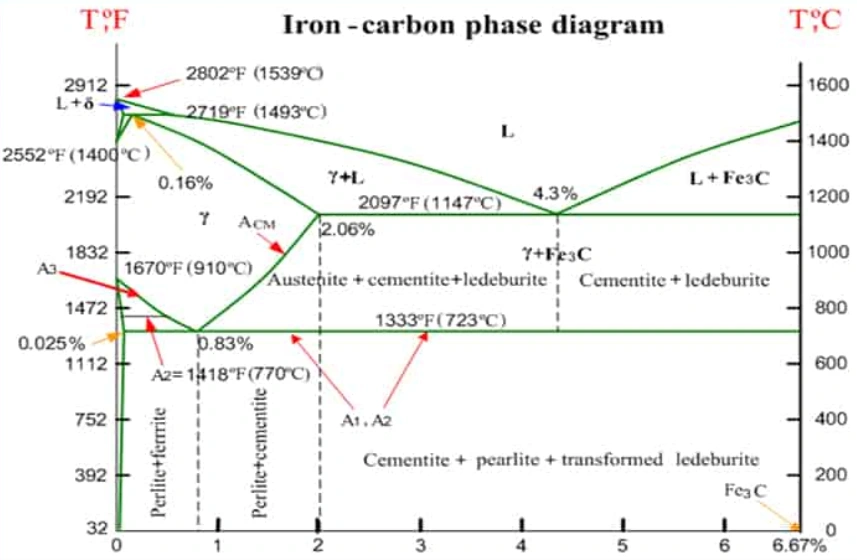
Boundaries
A1: Upper limit of the ferrite / cementite phase field
A2: Loss of magnetism for iron
A3: Boundary between austenite/ ferrite and γ austenite.
A4: α transforms to δ at high temperature
ACM: Boundary between the austenite / cementite field and γ austenite
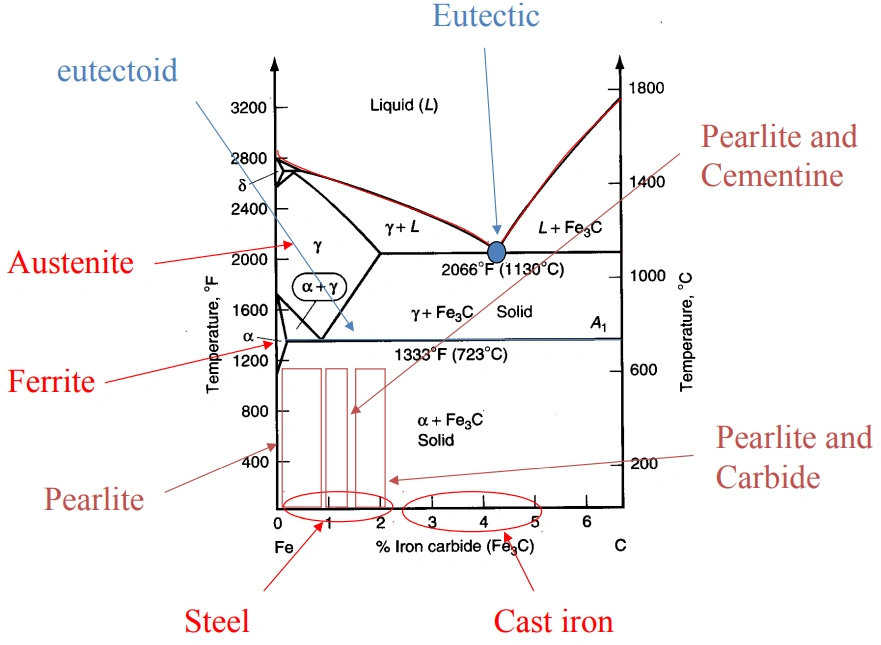
2. The Eutectic Point
The eutectic point in the iron carbon phase diagram is at 1,147 °C and 4.3% carbon content. It is the point where different phases meet. In the present phase diagram, the point is defined by the meeting point of A1, A3 and ACM.
The eutectic point
This point is characterized by the freezing of a liquid phase into two solid phases in what are termed as eutectic reactions. The specific mixture here consists of austenite and cementite.
3. Phase Fields
Phase fields are the areas within boundaries, which show different phases defined by particular conditions. The main phase fields in the iron and carbon equilibrium diagram are Hypoeutectoid Alloys, Eutectoid Alloys, and Hypereutectoid Alloys.
Try Prolean Now!
Types of Steel In The Iron Carbon Phase Diagram
The iron carbon phase diagram helps differentiate types of steel depending on their carbon content. Under this section, we identify the types of steel that can be referenced on the diagram. They include low carbon steels, medium carbon steels, and high carbon steels. Eutectoid steels are also covered.
First, here is a comprehensive table showing the types of steel in the iron-carbon phase diagram against their approximate carbon content and applications:
| Type of industrial steel | Carbon content | Metallurgical classification | Microstructure | Common Applications |
| Low Carbon Steel | 0.05 – 0.30 | Hypoeutectoid | Ferrite plus some Pearlite | Vehicle panels, structures, pipes |
| Medium Carbon Steel | 0.30 – 0.60 | Hypoeutectoid | Ferrite plus more Pearlite | Axles and shafts |
| High Carbon Steel | ~0.76 | Eutectoid | Pearlite – pure | Tough rails and springs |
| High Carbon Steel | 0.76 – 1.00 | Hypereutectoid | Pearlite plus Cementite (Fe₃C) | Wear-resistant parts, cutting tools |
| High Carbon Steel | 1.00 – 2.00 | Hypereutectoid | Pearlite plus more Cementite (Fe₃C) | Dies, |
High Carbon Steels
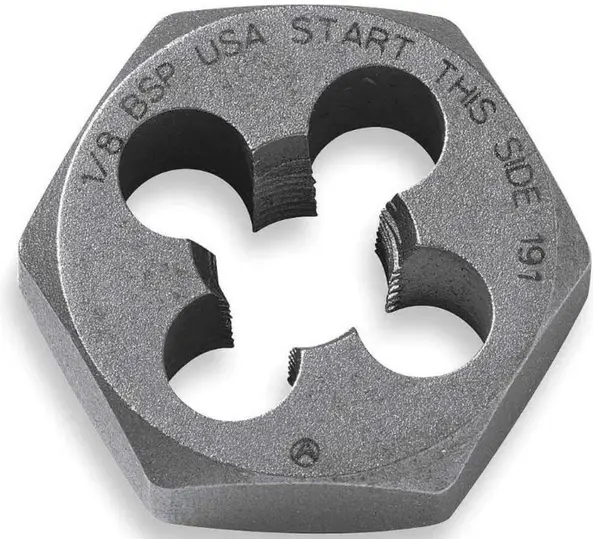
A high carbon steel die
This category of steel contains carbon of between 0.60% and 2.00%. It is composed of very strong and hard steel. The materials can also be corrosion resistant if chromium is not one of the alloying elements.
High carbon steels are widely used for dies and cutting tools due to their superior hardness and strength.
Medium Carbon Steels
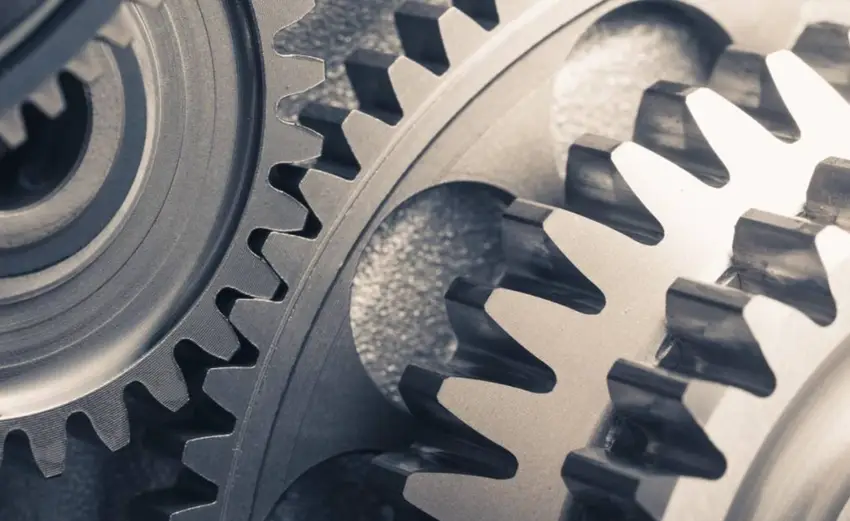
Medium carbon steel gears
In medium carbon steels, the carbon content is lower at between 0.30% and 0. 60%. This makes the materials fairly hard and strong with corrosion resistance. Medium carbon steels are ideal for machinery parts such as shafts, gears, and axles.
Low Carbon Steels
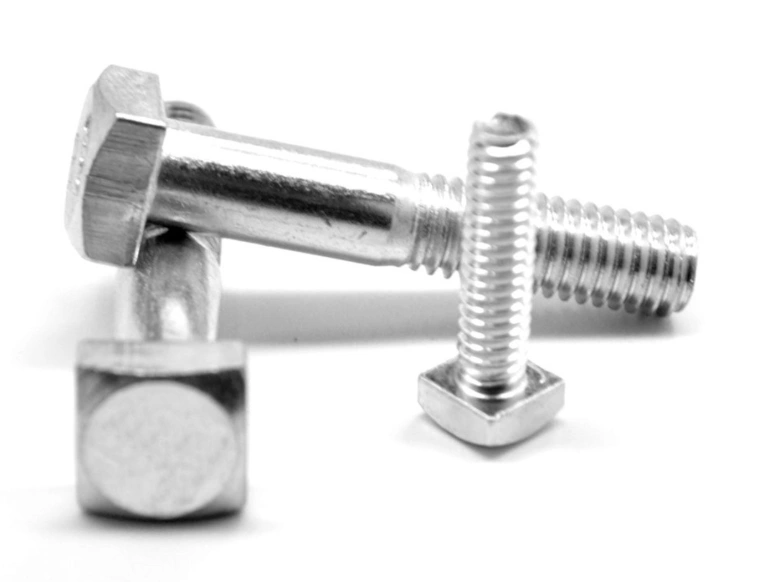
Low carbon steel bolts
Low carbon steels are found at an even lower carbon content of between 0.05% and 0.30%. Apart from being less pricey, these steels are relatively malleable and ductile. The materials are perfect for fasteners and pipes among other applications.
Applications in iron-carbon phase diagram
ProleanTech, Your Superior Manufacturer
ProleanTech is home to the best manufacturing processes for a broad range of metals and nonmetals. Our CNC machining, rapid prototyping, and related solutions are among the best in China and overseas.
Call and ask for an instant quote today!
We know that the insights in the iron carbon phase diagram have a bearing on the quality of our CNC Machining Services and related solutions. Therefore, we seek to optimize this tool in all our projects to deliver the best solutions.
Towards this end, we always expertly and precisely control all the factors during CNC machining of alloys. We are always keen to comply with standards that ensure predictable and dependable durability, strength, hardness, and corrosion resistance in parts.
Contact us today!
Conclusion
The iron carbon phase diagram is undoubtedly a critical tool in the CNC machining and other processes of iron-based alloys. It is a materials science solution that guides in heat treatment and choice of alloys to use for different projects. We hope you are now more enlightened on one of the major approaches used to identify the best materials for projects.
As the metallurgical field continues to advance, we can be sure engineers, metallurgists, and researchers will continue to refer to the iron-carbon phase diagram.

0 Comments